
By The Fiber Optic Academy · · 7 min read
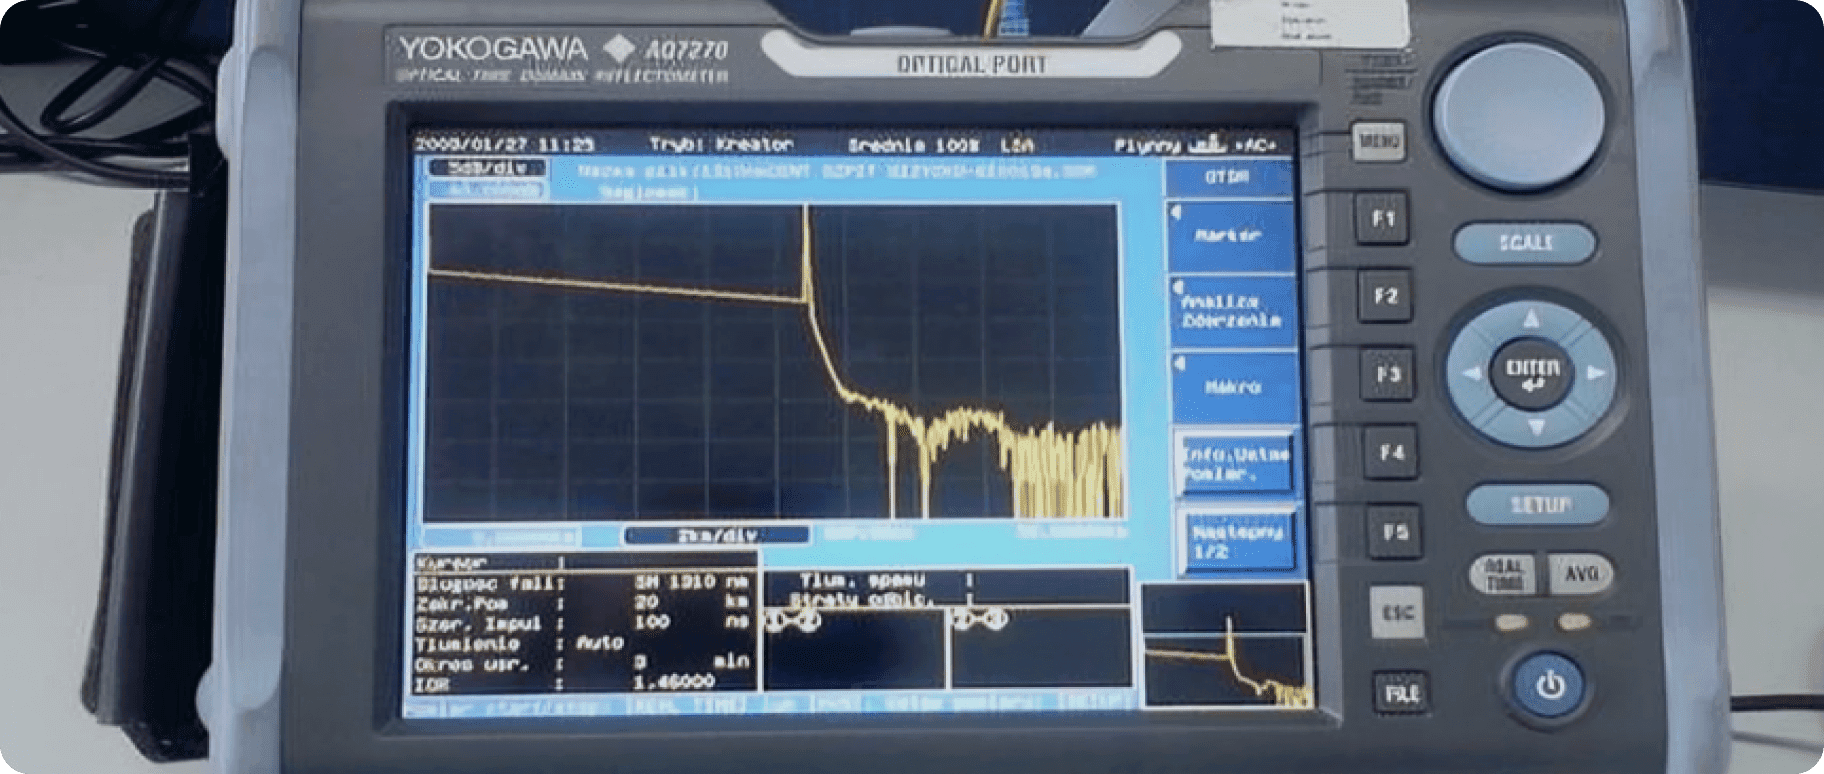
An optical time domain reflectometer (OTDR) sends short pulses of light into a fiber and measures the light that comes back. Plotting that returned light against distance gives you a trace: a picture of the whole link, including every splice, connector and break. Reading that picture correctly is one of the most valuable skills a fiber technician can have.
The Axes: Distance and Loss
The horizontal axis is distance from the OTDR. The vertical axis is the returned signal level in decibels (dB). Because light weakens as it travels, a healthy trace slopes gently downward from left to right. Everything you look for is a change in that line.
The Main Features of a Trace
1. The launch spike and dead zone
At the far left is a large spike where the pulse enters the fiber at the OTDR connector. Right after it is a dead zone, where the instrument is still recovering and can't see events. That's why technicians use a launch cable (a reel of fiber, often several hundred meters long) between the OTDR and the link under test, so the first real connector falls outside the dead zone.
2. The fiber slope
The straight, sloping sections are the fiber itself. The steepness of the slope is the fiber's attenuation per unit length. Longer wavelengths lose less in singlemode fiber, so a 1550 nm trace slopes less steeply than a 1310 nm trace of the same fiber.
3. Non-reflective events (fusion splices, bends)
A fusion splice usually appears as a small step down in the trace with no spike. The height of the step is the splice loss. A step at a point where there is no splice often means a bend or stress on the cable.
4. Reflective events (connectors, mechanical splices)
Connectors and mechanical splices create a spike (a reflection) followed by a step down (the loss). A large spike can indicate a dirty or damaged connector, so it is worth inspecting and cleaning before you assume the hardware is bad.
5. The end of the fiber
At the far end, the trace drops into noise. A cleanly cleaved or connectorized end usually shows a reflection before the drop; a break inside the cable may show a large reflection or none at all, depending on how it broke. Using a receive cable at the far end lets you measure the loss of the last connector, too.
Gainers: When a Splice Seems to Add Light
Sometimes a splice appears as a step up, which looks like a gain. It isn't: when two fibers with different backscatter characteristics are joined, the OTDR is fooled from one direction. The accepted practice is to test the link from both ends and average the two readings for each splice. This bidirectional averaging gives you the true splice loss.
Settings That Change What You See
- Pulse width: short pulses resolve events close together but don't reach as far; long pulses reach farther but widen dead zones.
- Range: set it beyond the length of the link so you can see the end clearly.
- Averaging time: longer averaging reduces noise, which helps on long links.
- Index of refraction: use the value from the fiber manufacturer so distances are accurate.
Common Mistakes New Technicians Make
- Testing without a launch cable, so the first connector hides in the dead zone.
- Reading splice loss from one direction only and recording a gainer as a 'good' splice.
- Skipping connector inspection: a dirty launch-cable connector distorts every measurement after it.
- Using the OTDR's automatic event table without checking the trace itself.
Practice Makes It Click
Trace reading becomes intuitive once you have tested real links with real faults. Our OTDR Fundamentals course and CFOS/T testing specialist course put an OTDR in your hands on live lab fiber, including splices, connectors and deliberate faults. For the theory behind it, the FOA's free Fiber U lessons are an excellent start.
Want hands-on OTDR practice? Contact TFOA about our next testing class.